Understanding the Unmeasurable: OTT

Over the past 8 months, VideoAmp has been monitoring changes in viewership behavior and what these changes mean for advertisers. Americans have been in the midst of a shift in how they consume content for some time, with a greater and greater share of TV tuning coming from streaming and via OTT. But the pandemic has exacerbated this shift; we all looked for shows to binge in the spring as we were home-bound, and economic conditions contributed to an acceleration in cord cutting among key audiences as people looked at cable bundles as an opportunity for cost savings.
With so much change in the viewing landscape, we wanted to look at what’s happening with OTT and how the shift is affecting the ways in which we are using TV. As is the case with rapid technology adoption, measurement of consumer behavior historically lags behind said behavior, and opportunities for advertisers historically lag behind shifting eyeballs.
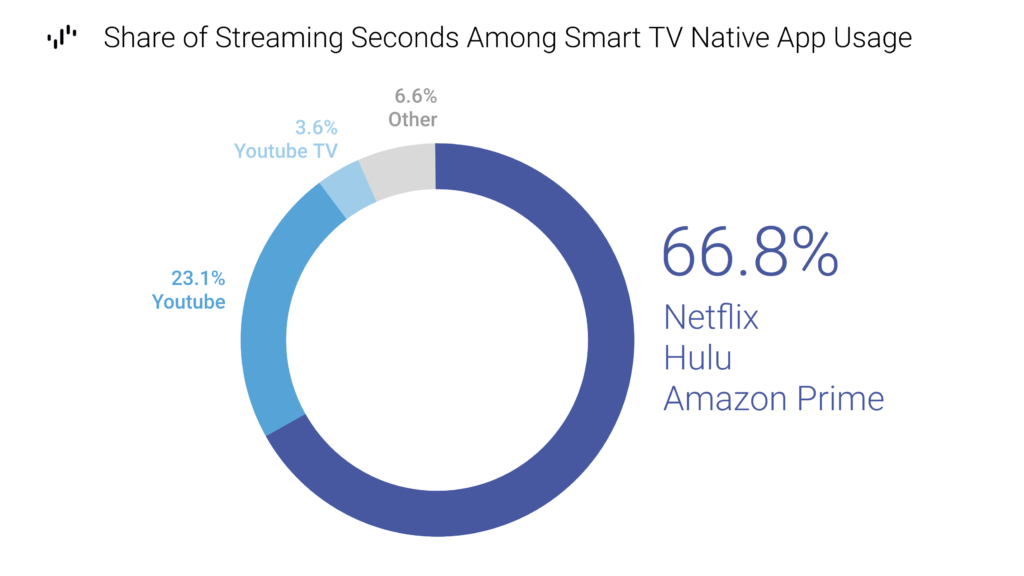
Two-Thirds of Smart TV App Usage Accrues to the “Big 3”
At least with respect to streaming via apps native to the Smart TV (as opposed to via external devices like Roku or Amazon Fire Stick), we saw that two thirds of time spent with streaming is spent with the “Big 3”– Netflix, Amazon Prime, and Hulu. As we know, Netflix and Amazon Prime are not ad supported, while Hulu has limited advertising. The industry at large will have to wrangle with this migration to largely ad-free environments as OTT proliferation continues.
YouTube, which is a robust ad platform, accounts for almost a quarter of native TV app tuning; YouTube TV, a vMVPD, accounts for almost 4%.
Creating OTT Viewing Cohorts
In order to further understand changing viewer dynamics, VideoAmp created four viewer targets, based on data from one of our Smart TV data partners. We took all OTT-viewing households from the second quarter of 2020, and split them into roughly even tertiles (Heavy-OTT, Medium-OTT, and Light-OTT); the remainder households constituted a fourth tertile, Non-OTT.
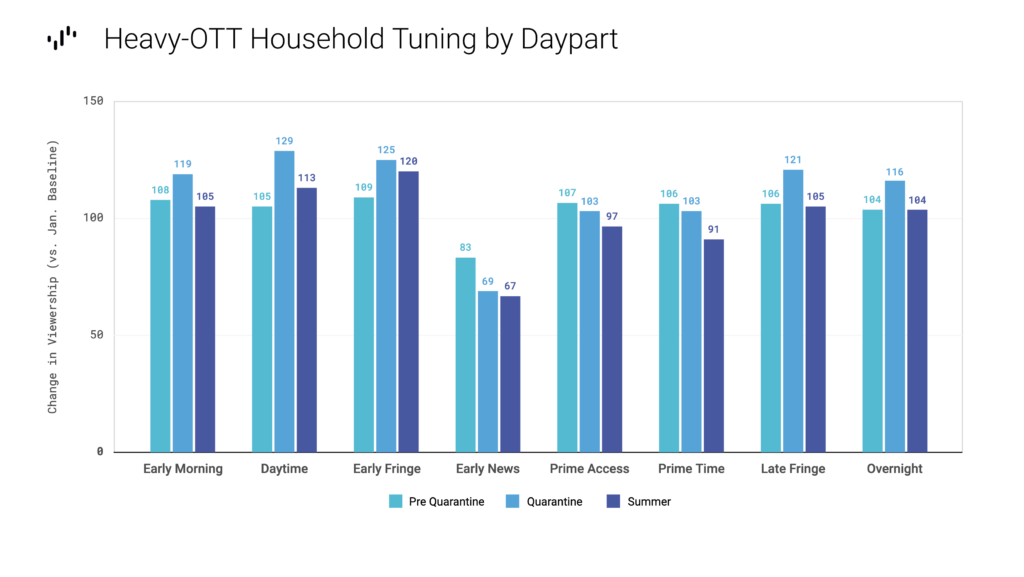
With these targets identified and created, we were able to measure changes in their behavior and better understand how OTT users are interacting with linear TV. In the charts below, we indexed linear TV against a January 2020 baseline, for three periods: Pre-quarantine (January 6-March 8); Quarantine (March 9-June 28); and Summer (June 29-September 6).
Heavy-OTT Viewing Households See Declines, Especially Into Summer Season
In looking specifically at linear tuning, we found that the Heavy OTT Viewing Households had a significant decline across key dayparts, including Prime and Prime Access, during quarantine. These declines continued into the summer months. Because these are heavy-OTT households, they are not watching less TV overall; but they are watching less linear TV, especially from Early News through the end of the viewing day.
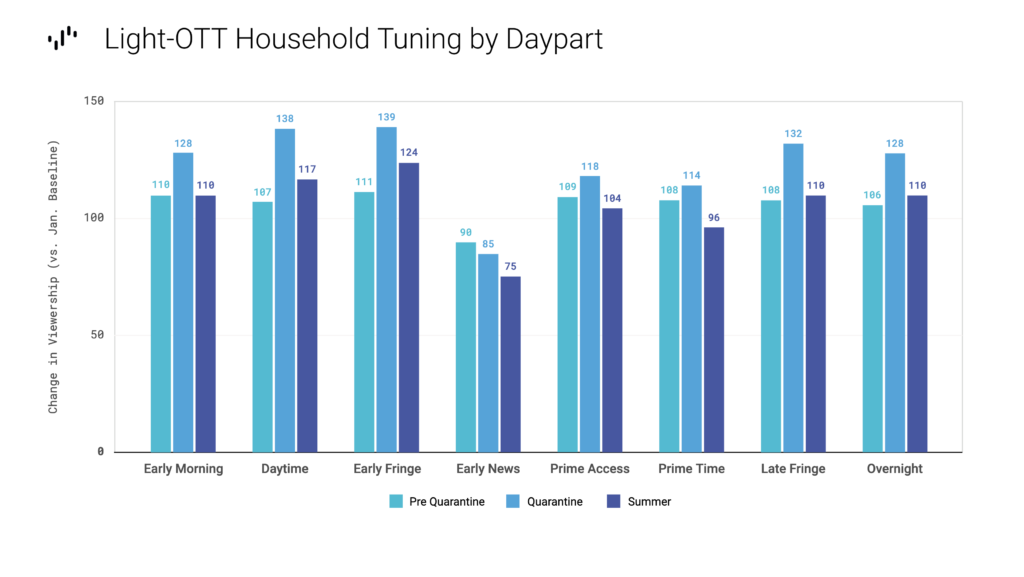
Not Surprisingly, Light-OTT Viewing Households Are Up
Conversely, Light-OTT households watched significantly more linear TV during quarantine- many dayparts for this cohort were up over 30%. In summer, when viewing typically lags, some dayparts are still up above pre-quarantine levels. And note that while Heavy-OTT households watched less linear TV in Prime Time during quarantine, Light-OTT households watched more.
By the way, Non-OTT households saw slighter increases than Light-OTT households in quarantine; these are generally a lighter-viewing cohort overall than the Light-OTT households. In a future blog post, we will look at the demographics of these OTT viewing targets.
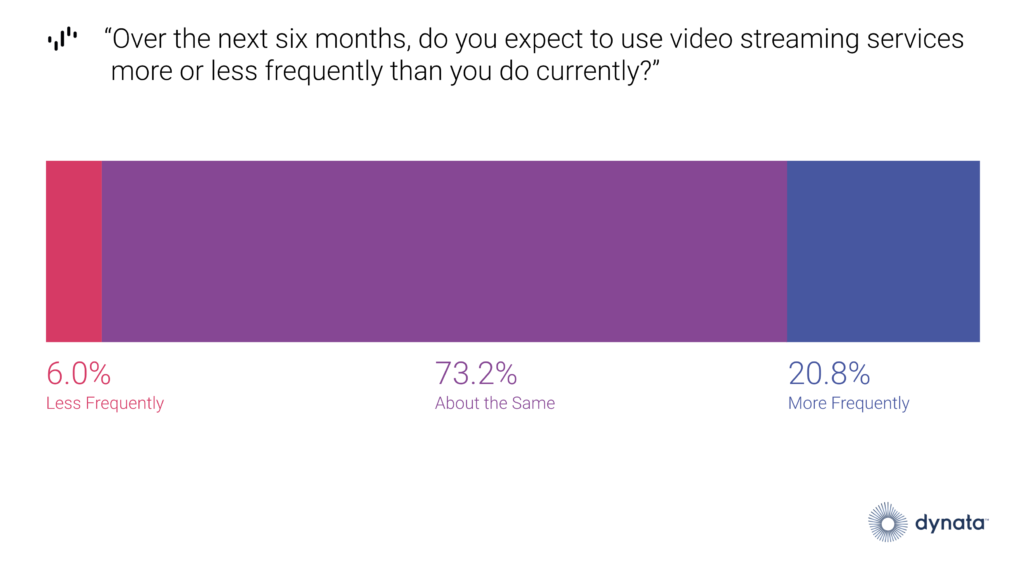
Looking Ahead: Intent to Stream
Many have been wondering what the outlook is for streaming and OTT. We saw the overall share of tuning to OTT relative to linear TV increase by 12%-15% since quarantine; will this shift hold?
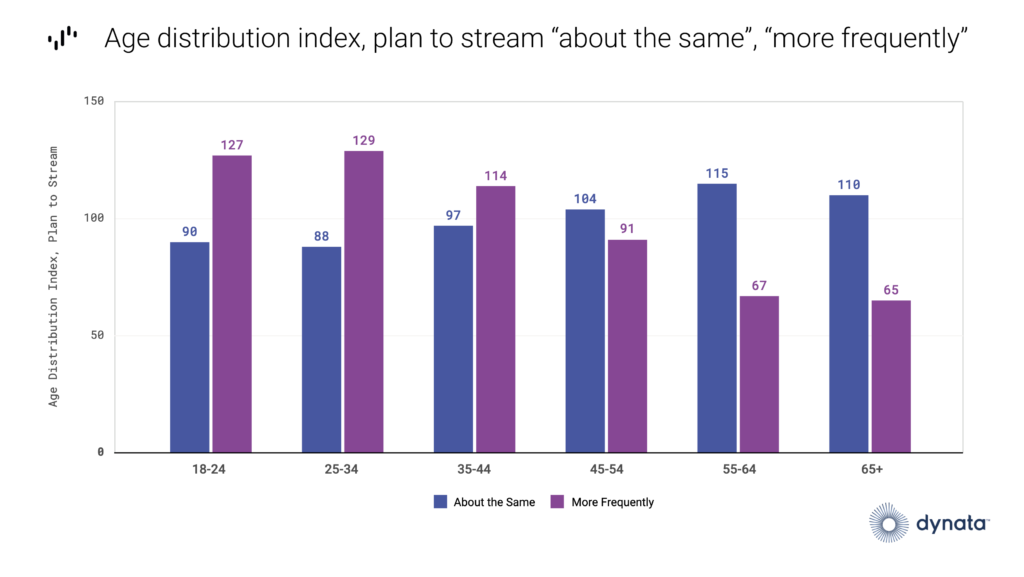
Working in collaboration with our partners at Dynata, we found that only 6% of persons 18+ plan to stream less frequently over the next 6 months; nearly three quarters plan to maintain current streaming levels, and about 21% actually plan to stream more.
Taking a somewhat deeper look into persons who plan to maintain or increase current streaming levels, we see that younger persons (18-44, but especially 18-34) are more likely to plan to stream more. Persons 45+ are more likely to maintain current streaming levels.
As 2020 rolls on, we are committed to identifying the changes that impact advertisers and their audiences, leveraging the most up to date data to support informed and impactful decisions. Though the migration to OTT has accelerated due to a multitude of factors (cost considerations, content availability, personalization), there is no denying that COVID-19 has catapulted this shift.
We will endeavor to share more insights into how TV usage is evolving in the coming weeks and months.